
Figure 1.
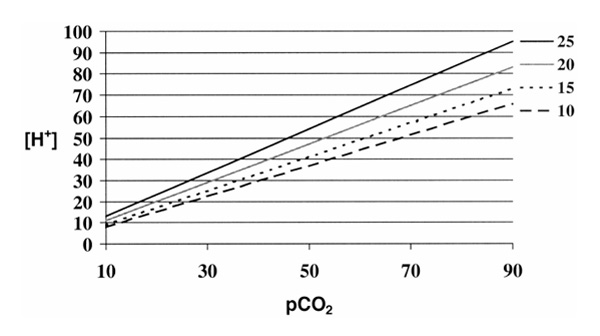
Changes in the relationship between partial carbon dioxide tension (pCO2) and H+ concentration as function of changes in 'buffer' strength. Individual curves are drawn for varying concentration of total nonvolatile buffers in mmol/l. Note that as the concentration of 'buffer' increases, the slope of the curve increases, making changes in H+ concentration more responsive to changes in CO2.