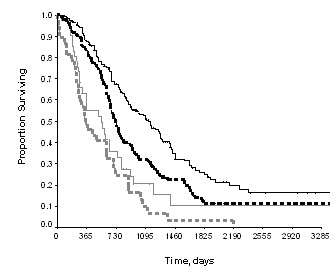
Figure 1.

Overall survival by IP therapy. Black lines: stage III ovarian cancer, IP therapy (the solid line) vs. without IP therapy (the dash line), χ2 = 9.41, P < 0.01; Gray lines: stage IV ovarian cancer, IP therapy (the solid line) vs. without IP therapy (the dash line), P > 0.05
