
Figure 1.
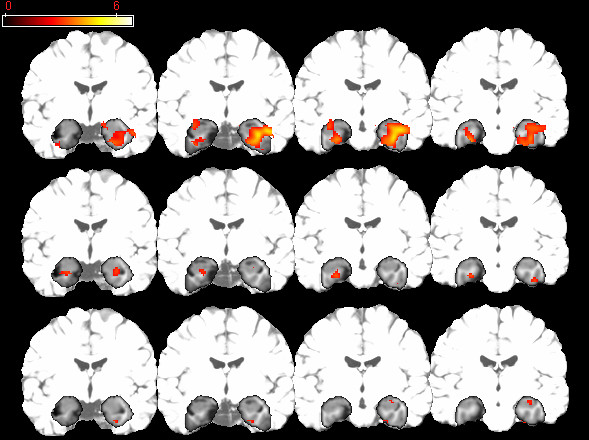
Activation Maps for fMRI task. Statistical parametric maps of the single-group analyses for ε3/3 homozygotes (panel A) and ε3/4 heterozygotes (panel B), and for regions where the ε3/3 homozygotes activated to a greater extent than the ε3/4 heterozygotes (panel C). The left side of each coronal section represents the left hemisphere. The dark-shaded area represents the MTL region to which the statistical analyses were confined. The lighter-shaded areasrepresent regions outside of the MTL mask.