
Figure 3.
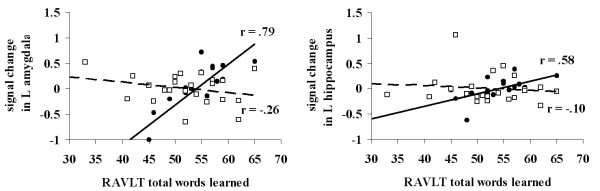
RAVLT versus Signal Change. Scatter plot of the association between total words learned on the RAVLT and signal change within the left amygdala (left panel) and left anterior hippocampus (right panel) for ε3/3 homozygotes (black circles, solid lines) and ε3/4 heterozygotes (white squares, hashed lines).