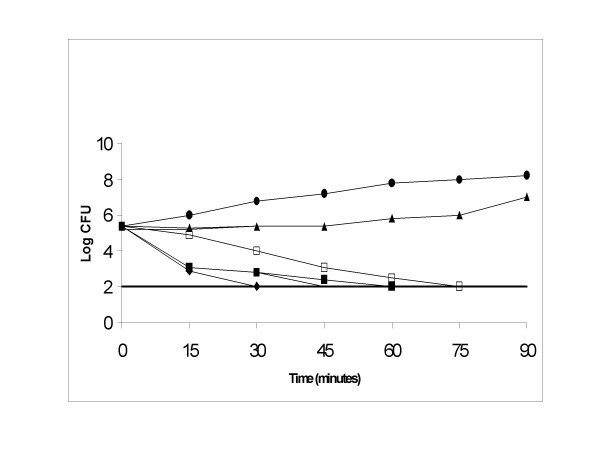
Figure 2.
Effects of eugenol and cinnamaldehyde on the growth of E. coli NCIM-2089. E. coli was exposed to eugenol at concentrations of (◆) 2 μg/ml, (■) 1 μg/ml, (▲) 0.5 μg/ml, (●) control, and to cinnamaldehyde at concentrations of (◊)2 μg/ml, (□) 1 μg/ml, (△) 0.5 μg/ml. Detection limit was shown with a straight line. The controls were maintained with 0.1% DMSO.

