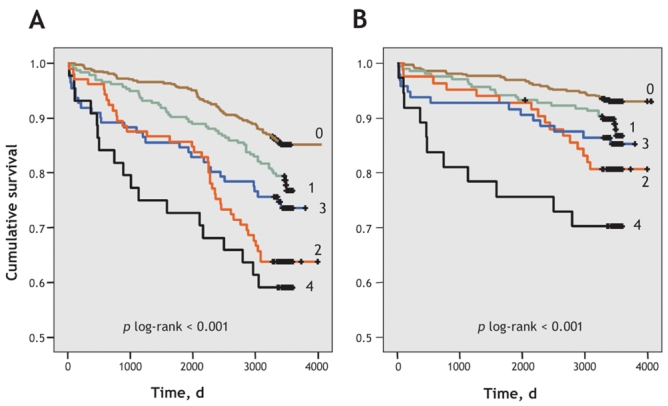
Fig. 1: Kaplan–Meier curves for all-cause and CAD-related death according to the number of plasma biomarkers (interleukin-6, serum amyloid A protein, C-reactive protein and total homocysteine) in the fourth quartile. A: The number of all-cause deaths per total number of patients in each category are as follows: 0 biomarkers, 69/471; 1, 51/235; 2, 38/105; 3, 29/111; 4, 18/44. B: The number of CAD-related deaths per total number of patients in each category are as follows: 0 biomarkers, 30/471; 1, 24/235; 2, 16/105; 3, 14/111; 4, 11/44.
