
Fig. 1.
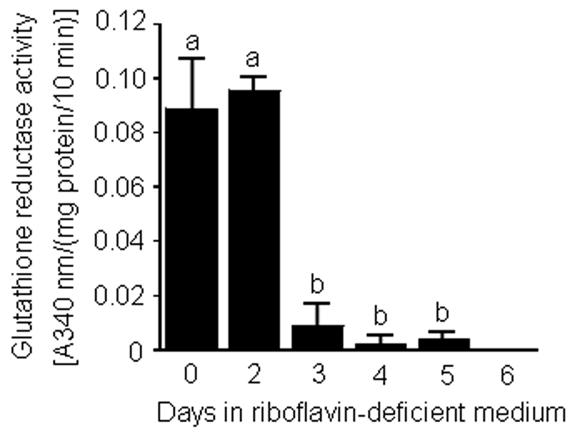
Time course of glutathione reductase activity in HepG2 cells in response to transfer "from riboflavin-sufficient medium (532 nmol/L, day 0) to riboflavin-deficient medium (3.1 nmol/L). a,bBars not sharing the same letter are significantly different (P < 0.05; n = 4). Means ± SD are shown.