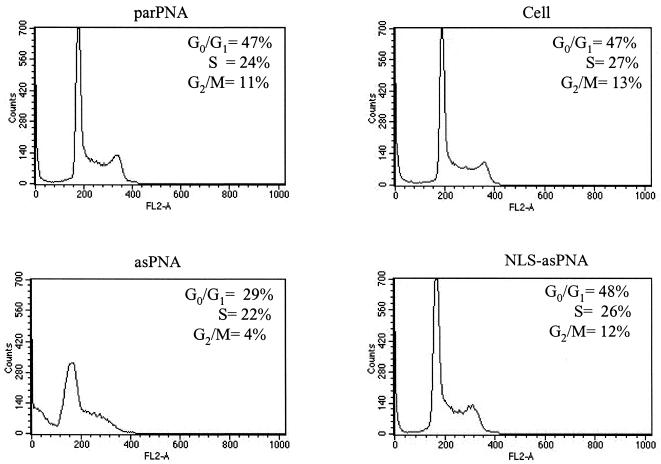
Figure 8.
Cell cycle analysis of PNA-treated KYO-1 cells. KYO-1 cells grown for 30 h in medium containing 10 µM PNA were subjected to cell cycle analysis. Cells were stained with propidium iodide and analysed by flow cytometry. Inset numbers indicate the percentage of cells in the phases of the cell cycle. The percentages of dead cells are 18 and 14% in parPNA- and NLS-asPNA-treated cells respectively, 13% in PNA-untreated cells and 45% in asPNA-treated cells; this high value may be due to apoptosis.

