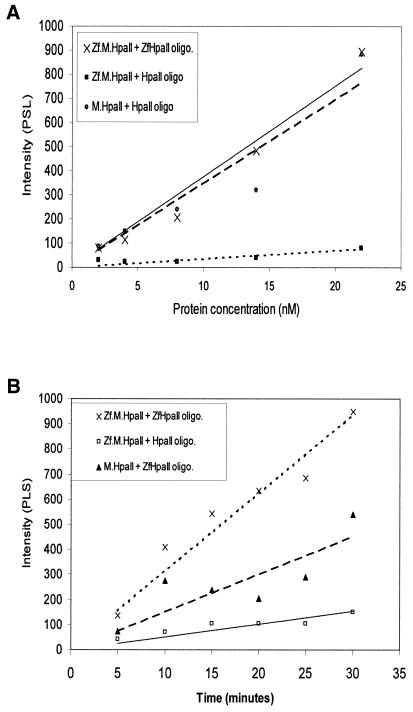
Figure 3.
Titrational and time course analysis of targeted and non-targeted HpaII methylation for different oligonucleotide substrates. (A) Increasing concentrations of Zf.M.HpaII and M.HpaII enzyme were incubated with ZfHpaII or HpaII oligonucleotides (final concentration 150 nM) over the concentration range shown. The relative levels of methylated oligonucleotide, as evaluated by phosphorimager analysis, were plotted against protein concentration. The intensity of the tritiated oligonucleotides are plotted as PSL values (photo-stimulated luminescence), which are directly proportional to the radioactivity of the samples being measured. The best fit line for Zf.M.HpaII binding to ZfHpaII oligonucleotide is denoted by a solid line. (B) Time course methylation profile for the interaction of targeted and non-targeted HpaII with oligonucleotide substrates. Reactions contained 20 fmol protein and 3 pmol DNA (for details see Materials and Methods).

