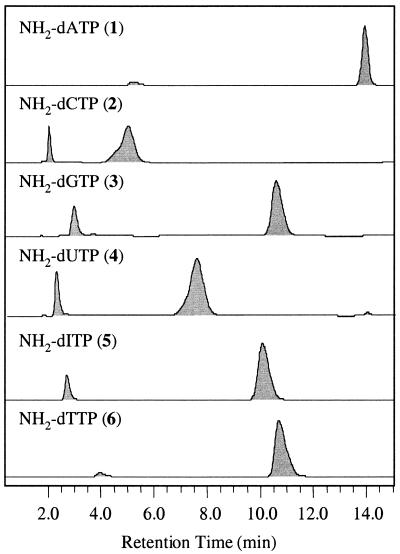
Figure 1.
HPLC chromatograms of reaction mixtures containing NH2-dATP, NH2-dCTP, NH2-dGTP, NH2-dUTP, NH2-dITP and NH2-dTTP. The conversion yield was determined by comparing the areas of the late eluting peak (nucleotide 5′-N-triphosphate) versus the early eluting peak (nucleoside) in each chromatogram.

