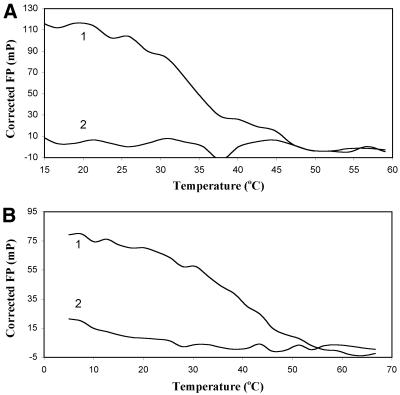
Figure 2.
Melting curve detection by FP. The experiment was performed as described in the Materials and Methods. Shown are (A) LNA 715, 5′ Rho-TAGTATG; and (B) LNA 607H, 5′ Hex-ACGGAG at 50 nM concentration in the presence of 50 nM perfect-match (curve 1) or mismatch (curve 2) targets. FP correction was performed by subtraction of the free-probe FP at each temperature.

