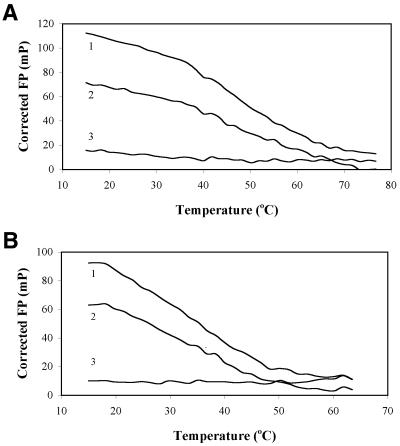
Figure 3.
SNP genotyping by FP melting curve measurement. The experiment was performed as described in Results. Shown are the melting curves when PCR reactions were analyzed with (A) LNA 601, 5′ Rho-GTCGCC; and (B) LNA 602, 5′ Rho-GTCACC. In both (A) and (B), curves denote the following: 1, homozygous perfect-match DNA; 2, heterozygous DNA; and 3, homozygous DNA of opposite genotype.

