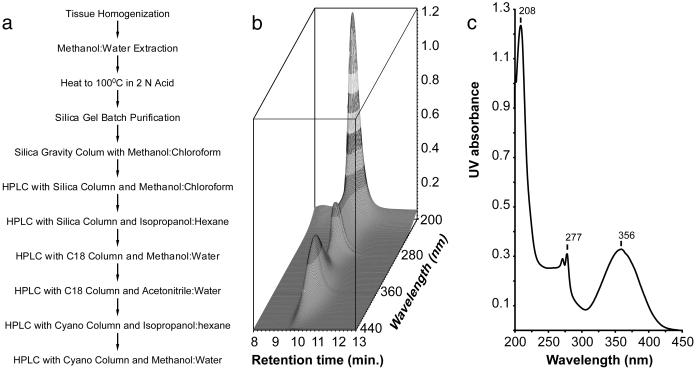
Fig 1.
AHR ligand purification and UV spectrum. (a) Flow chart showing the steps taken in purifying the ligand. (b) The photodiode array representation of an HPLC chromatogram of the purified AHR ligand (3 μg). x axis, retention time in minutes; y axis, wavelengths monitored in nanometers; z axis, UV absorbance. (c) UV spectrum of the AHR ligand. The spectrum was taken at an HPLC retention time of ≈10 min, at which moment the UV absorbance reached the maximum. x axis, wavelengths in nm; y axis, UV absorbance.

