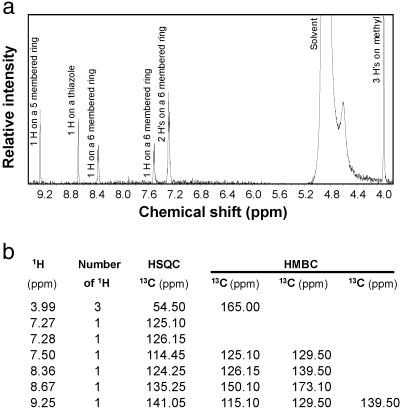
Fig 3.
Proton NMR spectrum and proton-carbon-13 correlations. (a) 1H NMR spectrum of the AHR ligand in d-methanol. The peak labeled Solvent is contributed from NMR solvent. No signal existed in the solvent masked area confirmed by examining a spectrum taken in d-chloroform (data not shown). Signals contributed from numbers and locations of the protons are as labeled. (b) Table of 1H-13C correlation of the AHR ligand from both HSQC and HMBC spectra. The protons and carbon-13s with detectable connections are listed in the same row. The carbon-13s listed under a column headed HSQC are the ones directly connected (through one bond) to the corresponding proton(s) (in the same row), whereas the ones under the columns headed HMBC are connected to the corresponding proton(s) through 2–3 bonds.

