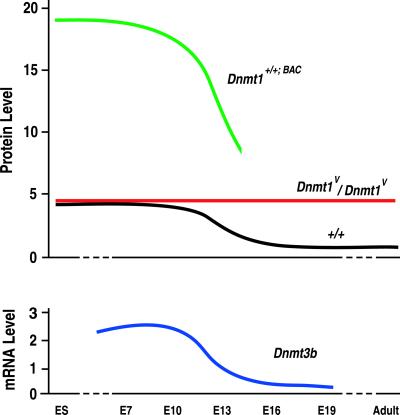
Fig 5.
Time courses of protein and mRNA concentrations during development in Dnmt1+/+;BAC transgenic, WT, and Dnmt1V mice. (Upper) The relative concentrations of the Dnmt1o and Dnmt1 proteins are plotted in ES cells, embryos, and adults. The estimated time course of Dnmt1 protein concentration in Dnmt1+/+;BAC transgenic mice (21) was determined by assuming a continuous fourfold excess of Dnmt1 protein compared to WT levels. Dnmt1+/+;BAC embryos died by E14. The relative time courses of Dnmt1o and Dnmt1 concentrations in homozygous Dnmt1V/Dnmt1V and WT mice, respectively, are taken from Figs. 2A and 4 A and B. (Lower) The relative time course of Dnmt3b mRNA concentration was determined from the data presented in Okano et al. (23).

