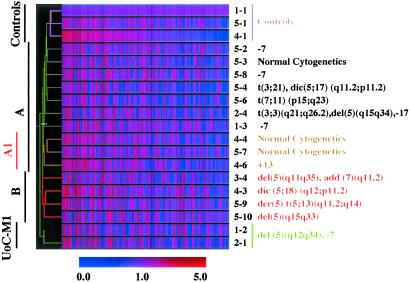
Fig 1.
Two-dimensional hierarchical clustering of gene expression data for 2,945 genes. Each row represents a leukemia sample and each column represents a single gene. The figure illustrates the ratio of hybridization signal intensity of cRNA prepared from each experimental mRNA sample to that of control sample 1-1. Expression levels greater than the normal control value are shown in red, and levels less than this value are shown in blue. Increasing distance from the control value is depicted by increasing color intensity. Recurring cytogenetic abnormalities for the corresponding samples are listed on the right.

