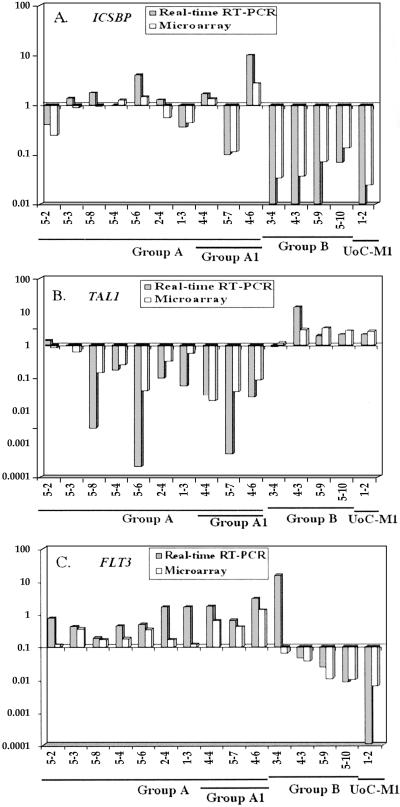
Fig 4.
Comparison of ICSBP (A), TAL1 (B), and FLT3 (C) gene expression data obtained by microarray analysis (open bars) and real-time RT-PCR analysis (shaded bar). The y-axis represents the log base ratio of fold-change in gene expression from each sample to the average of three control samples. The x-axis represents different samples.

