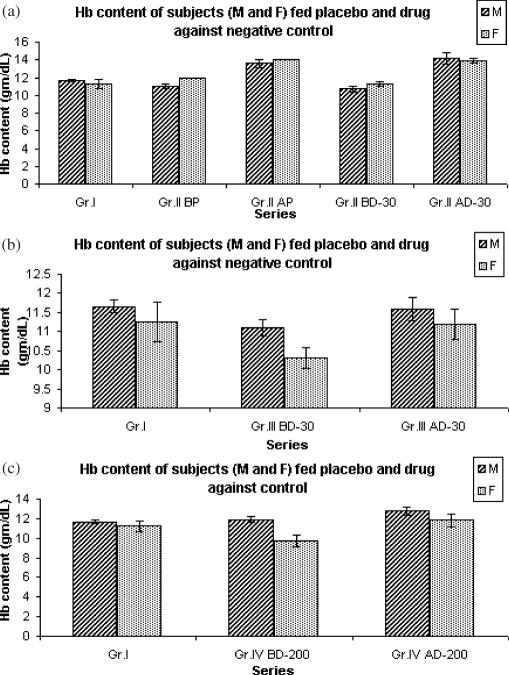
Figure 5.
(a) Histogram showing changes in hemoglobin content of subjects fed either placebo or drug (Ars alb-30) of 1 month treatment against negative control; statistical significance levels calculated by considering differences between data of subjects of Group I and Group II, and within Group II before and after administration of either placebo (BP) or verum (BD-30); aP < 0.05; bP < 0.01; cP < 0.001. (b) Histogram showing changes in hemoglobin content of subjects fed drug (Ars alb-30) for 2 months against negative control; statistical significance levels were calculated by considering differences between Group I and Group III before drug administration and within Group III before and after administration of the drug (Ars alb-30). (c) Histogram showing changes in hemoglobin content of subjects fed drug (Ars alb-200) for 2 months; statistical significance levels were calculated between Group I and Group IV before administration of the drug and within Group IV before and after administration of the drug (Ars alb-200).

