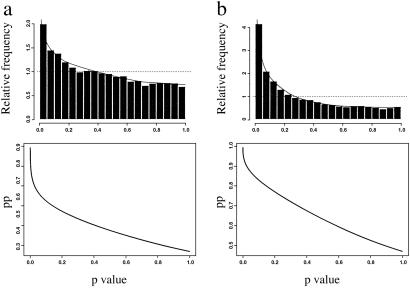
Fig 1.
Distribution of P values and pp for 9,977 genes in the (a) aging comparison (30- and 5-month-old control fed animals) and (b) CR comparison (30-month-old CR and 30-month-old control diet-fed animals). (Upper) The distribution of the P values for all genes representing in the oligonucleotide array. The fitted model was a mixture of one uniform (…) and one beta (—) distribution. The null (uniform) proportions were 0.7285 (a) and 0.5304 (b), and the alternative (beta) proportions were 0.2715 (a) and 0.4696 (b). (Lower) The pp of the 9,977 genes along with their corresponding P values.

