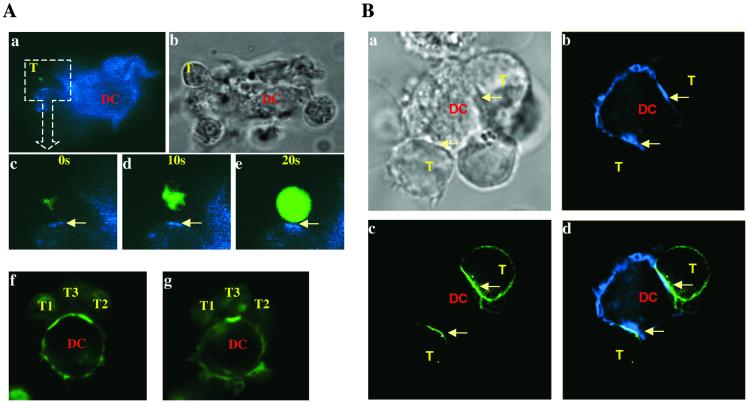
Fig 2.
Visualization of functional clusters of covalent agonist MHC class II/peptide complexes and TCRTg/CD3 complexes (arrows) at the T cell–DC interface. Naive TCRTg CD4+ T cells loaded with fluo-3 (A) or effector TCRTg CD4+ T cells transduced with CD3ζ-YFP (B) were mixed with AbIi− DCs expressing agonist AbPCCVA-CFP (blue, A a–e and B b–d) or AbPCCVA-YFP complexes (green, A f and g). Photo recording started 20 min after initial contact of a T cell with a DC (A c–e). T cell activation, detected by calcium flux (note the increase in green fluorescence), was recorded every 10 s. (A f and g) Two different Z-sections of one DC interacting with three naive TCRTg CD4+ T cells. (B b–d) One DC interacting with two effector T cells. (Bb) Clusters of AbPCCVA-CFP on DCs. (Bc) Clusters of TCR/CD3 on T cells. (Bd) An overlay of Bb and Bc. The AbPCCVA complexes were clustered in 82% of recorded contacts between DCs and naive T cells, in contrast to null AbEp complexes, which were clustered in 9.2% of contacts (not shown). Four independent experiments were done and at least 30 contacts per experiment were analyzed (Table 1). (Ab and Ba) DIC images; T, T cell; DC, dendritic cell.

