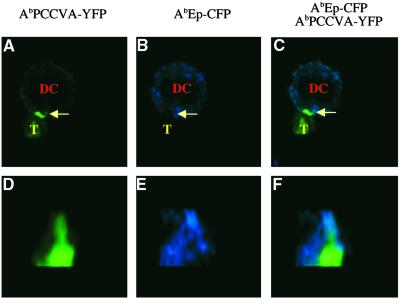
Fig 3.
Naive CD4+ T cells expel null MHC class II/peptide complexes from the center of the contact sites with DCs. Naive TCRTg CD4+ T cells (T) were loaded with calcium indicator fluo-3 and mixed with AbIi− DCs expressing agonist AbPCCVA-YFP and neutral AbEp-CFP complexes. (A–C) A single 2D optical section in the center of the cell conjugate. (D–F) A 3D view of the T cell–DC contact. (A and D) AbPCCVA-YFP only (green). (B and E) AbEp-CFP only (blue). (C and F) AbPCCVA-YFP and AbEp-CFP overlay. Agonist AbPCCVA complexes were clustered in 76% of recorded contacts between DCs and T cells. Of the clusters, 61% were characterized by the expulsion of neutral AbEp-CFP complexes. Exclusion of a particular complex was defined as at least a 50% decrease in the intensity of fluorescence in comparison with the intensity in the proximity of the place of contact (Fig. 6, which is published as supporting information on the PNAS web site). Three independent experiments were done, and a total of 88 contacts were analyzed (Table 1). This phenomenon was also observed in the opposite experimental setup, where TCR-specific Ab/PCCVA complex was labeled with CFP and neutral Ab/Ep complex was labeled with YFP (data not shown; Fig. 7, which is published as supporting information on the PNAS web site).

