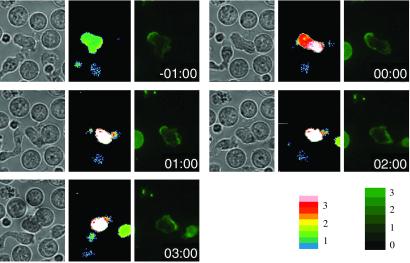
Fig 1.
Initial polarization and antigen-specific repolarization of CD3ζGFP in D10 T cell clones. T cells transfected with CD3ζGFP were imaged at 15-s intervals during contact with 10 μM CA-134-146-peptide-pulsed APCs. Data show the FURA ratio overlayed with the contrast image and the GFP intensity in a mid z plane at the indicated times relative to first contact. For a movie version of this figure, see Movie 1, which is published as supporting information on the PNAS web site, www.pnas.org.

