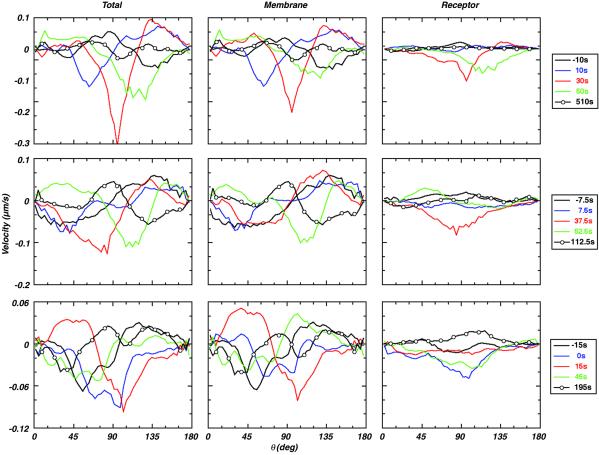
Fig 3.
Instantaneous velocities of CD3 molecules in a developing synapse assessed by 3D quantitation. Calculated temporal and angular dependence of three different velocity measures for three T cells. The “Receptor” velocity describes movement of the receptors, with respect to the membrane motion. The “Membrane” velocity describes only the movement of cell membrane. The “Total” velocity is the sum of the Membrane and Receptor velocities. The data for the three cells show two distinct features: (i) early time velocities can be attributed to a conformational wave that transits the membrane (compare black, blue, and red Membrane and Total velocities); and (ii) preflux Receptor velocities are small, followed by a large increase in receptor motion toward the synapse between 0 and 30 s after flux. Note that negative velocities are toward the synapse.

