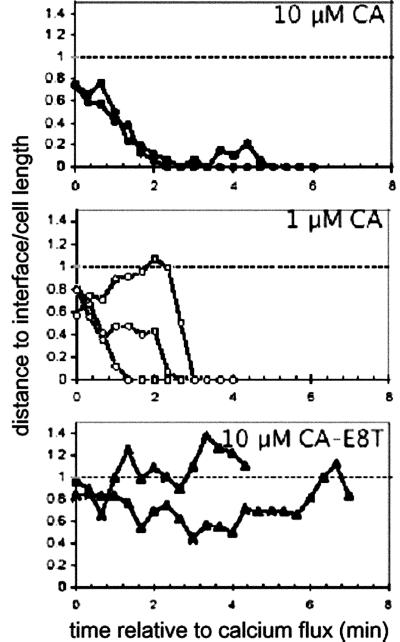
Fig 4.
Single particle tracking of TCR recruitment to the nascent immunological synapse. Example time-lapse positions of nanosphere-labeled TCRs. Coordinates of each nanosphere in (x, y, z) space were determined from 3D fluorescence images, and the distance from each particle to the interface was calculated by using differential interference contrast images to determine the interface location. Shown are the distances of each particle from the interface at each time point normalized by the length of the cell of individual nanospheres on single T cells responding to APCs pulsed with: •, 10 μM CA 134-146; ○, 1 μM CA 134-146; ▴, 10 μM CA 134-146-E8T. Representative movies of responses to agonist and weak-agonist recruitment are published as Movies 1–3 on the PNAS web site.

