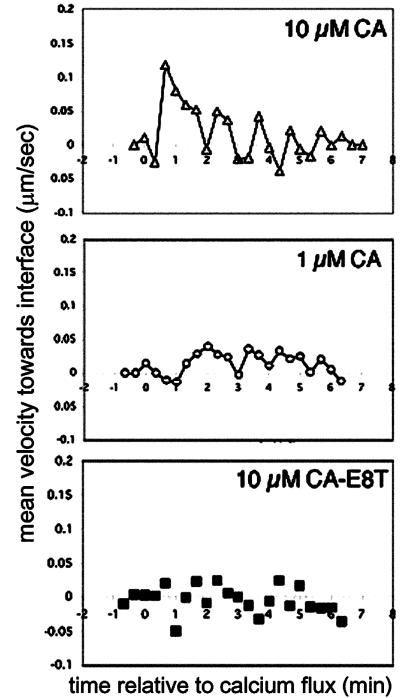
Fig 5.
Velocities of TCR as measured by single particle tracking. Instantaneous velocities of nanosphere-labeled TCRs as a function of time were measured by tracking position changes as a function of time. Motion of the tail of T cells was subtracted to correct for translation of the whole cell, as described in Methods. Shown are mean velocities of nanospheres (n ≥ 10) as a function of the time relative to initial intracellular calcium elevation for TCRs on T cells responding to APCs pulsed with 10 μM CA (Top), 1 μM CA (Middle), or 10 μM CA-E8T (Bottom).

