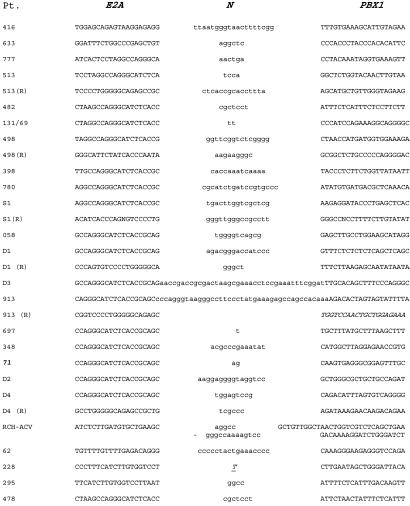
Fig 4.
Fine structure of E2A-PBX1 genomic fusions. Patient number is displayed with the E2A and PBX1 sequences proximal to the fusions and N-nucleotides that were present between the E2A and PBX1 sequence (lowercase letters). The antisense strand of the reciprocal fusions (R) are displayed. Cell line RCH had two segments of N-nucleotides along with a tandem duplication of 30 nucleotides of PBX1 sequences shown in between, derived from sequence 7,398 bp 3′ of the breakpoint in reverse orientation. The “T” is a microhomology nucleotide (derived from E2A or PBX1, not an N-nucleotide). The reciprocal partner fusion to 913 is in italics, indicating a fusion of E2A to RODH intron 2.

