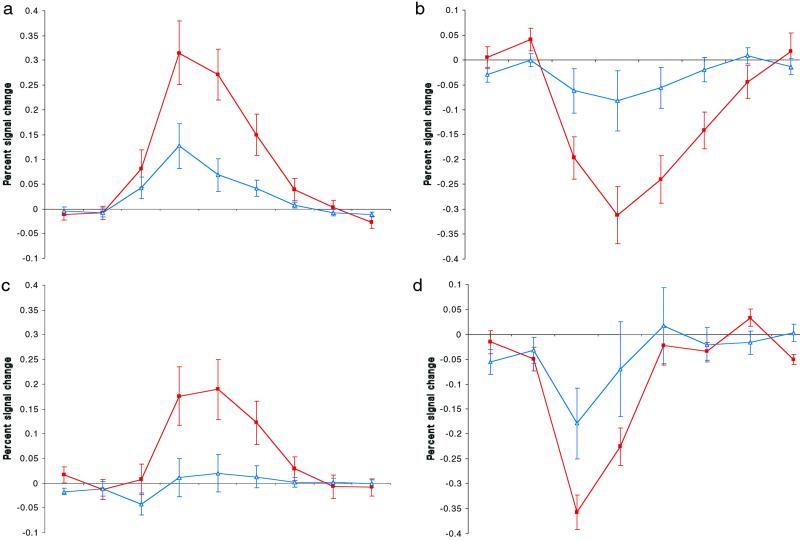
Fig 3.
The hemodynamic time courses in the left inferior prefrontal (a) and the left inferior temporal cortex (c) were characterized by activations above baseline for Object trials (filled red squares) and either modest or nonsignificant activations for Person trials (open blue triangles). In contrast, the dorsal medial prefrontal (b) and right lateral parietal cortices (d) were characterized by significant deactivations for Object trials, along with no significant modulations for Person trials, a pattern typical for areas identified in Person > Object comparisons. Time courses were calculated by collapsing across multiple clusters within a neuroanatomical region (except for the dorsal medial prefrontal cortex, for which only one cluster was identified). The scale is seconds (one second per hash mark). Error bars display the standard error of the mean.

