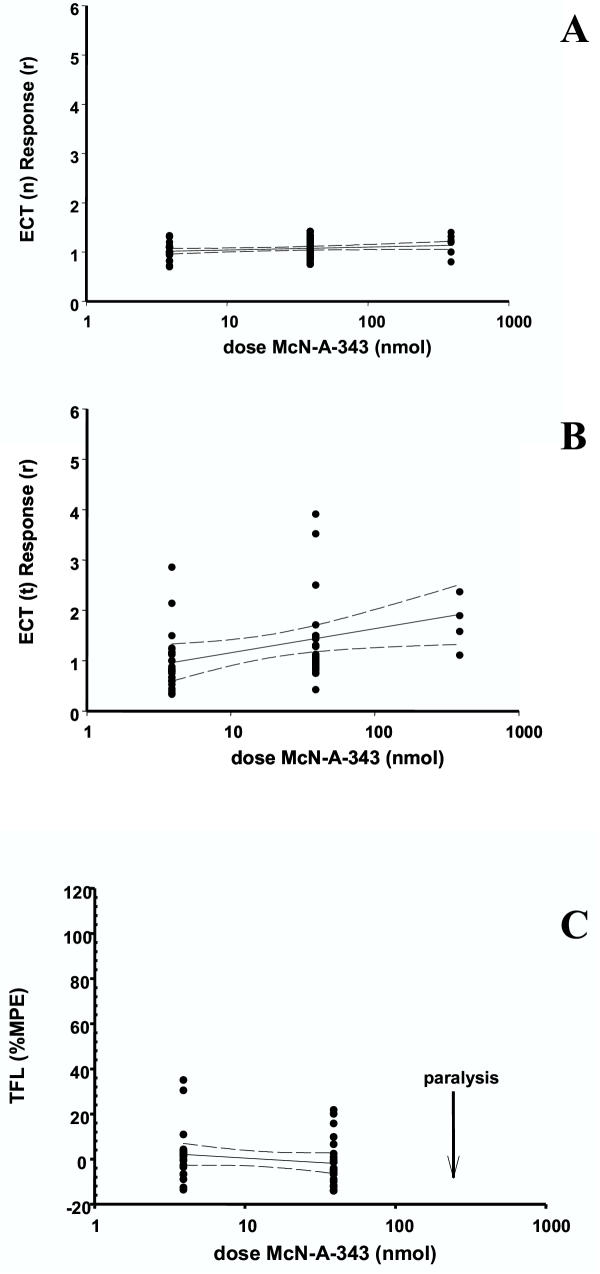
Figure 3.
Dose response curves for the spinally mediated antinociceptive effects of intrathecal McN-A-343 The values for ECT (neck, panel A; tail, panel B) and TFL (panel C) are shown on a scatter plot against dose of intrathecal McN-A-343. Only the results from testing times when there was no significant rise in ECT (n) values are shown. These values have been subjected to a logistic regression shown by the continuous line bounded by ± 95% CI shown as broken lines.

