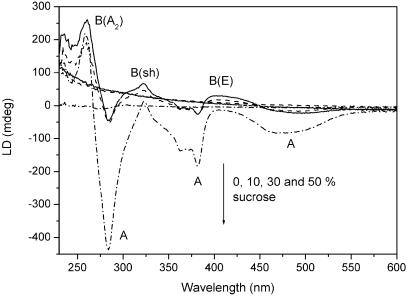
Fig 3.
LD of soy lipid liposomes (sloping spectra) and the membrane probe Ru(phen)2dppzcpCOOCH3 in the bilayer of the same liposomes (structured spectra), in the presence of varying sucrose concentrations (0%, 10%, 30%, and 50% wt/wt) in the aqueous buffer. The arrow shows increasing sucrose concentrations.

