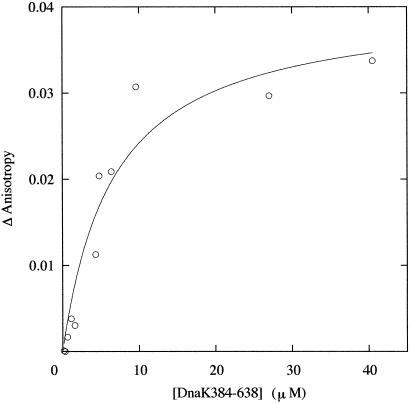
Fig 2.
Titration of FITC-RCMLA with DnaK384-638. The measured increase (Δanisotropy) from the initial anisotropy value is plotted on the y axis. The titration was performed with 0.25 μM FITC-RCMLA in 10 mM Tris, pH 7.0, at 15°C. Lines through the data points are the results of the fit with a simple binding model. The fitting was done by using the nonlinear least-squares method with kaleida graph.

