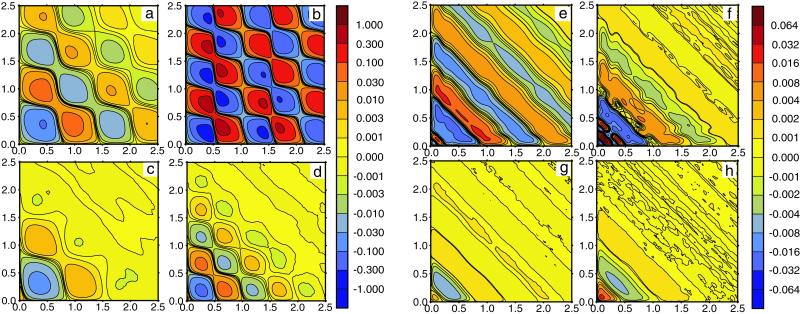
Fig 3.
Memory landscapes of single enzymes. (a–d) Single-path model. Statistical dispersions of turnover times are ξ = 0.1 (a and b) and ξ = 0.4 (c and d); substrate concentrations are S = 0.0625 mmol⋅liter−1 (a and c) and S = 1 mmol⋅liter−1 (b and d). Other parameters are the same as in Fig. 2 a and b. (e–h) Double-path model. Statistical dispersions of turnover times are ξ = 0.1 (a and b) and ξ = 0.4 (c and d); substrate concentrations are S = 0.5 mmol⋅liter−1 (a and c) and S = 1.5 mmol⋅liter−1 (b and d). Other parameters are the same as in Fig. 2 c and d. Memory functions f(τ1, τ2) are plotted using color codes indicated by vertical bars on the right side of the panels.

