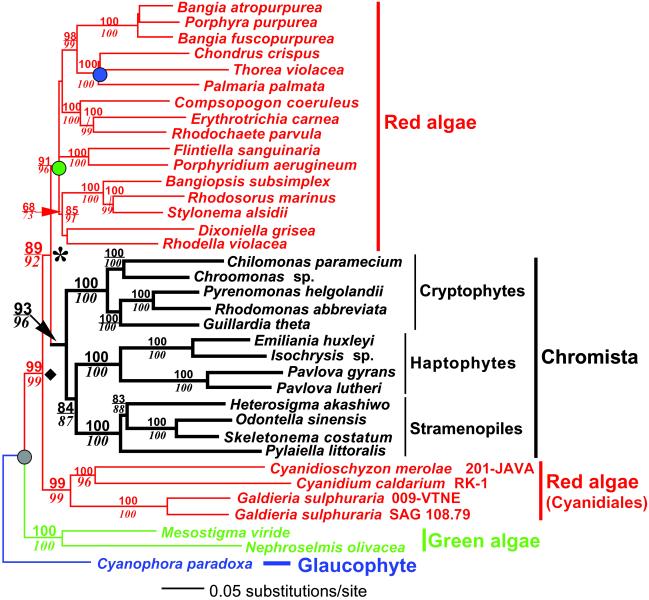
Fig 1.
Phylogenetic relationships of red algal (shown in red typeface) and chromist (shown in black typeface) plastids inferred from a minimum evolution analysis of the combined DNA sequences of 16S rRNA, psaA, psbA, rbcL, and tufA. Results of a ME-gtr bootstrap analysis are shown above the branches, and bootstrap values from a ME-ld analysis are shown below the branches in italics. This tree is rooted on the branch leading to the Cyanophora paradoxa sequence. The branch lengths are proportional to the number of substitutions per site (see scale in figure). The filled circles indicate nodes that were constrained for molecular clock analyses (gray = 1,576 Ma; green = 1,174–1,222 Ma; blue = 550–590 Ma). The estimated nodes are indicated by the diamond (1,342 ± 22 Ma) and the asterisk (1,261 ± 28 Ma).

