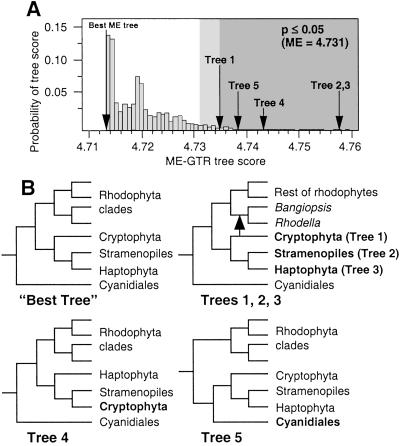
Fig 2.
Analysis of rearranged plastid trees using the TLDB test. (A) The distribution of suboptimal ME-gtr bootstrap trees. The area shown in light gray falls outside the 95th quantile (ME score0.05 = 4.73), whereas the darker area defines the region outside the 99th quantile (P ≤ 0.01). The score for the best ME-gtr tree is shown, as are the scores for the rearranged trees. (B) Schematic drawings of tree rearrangements used to test Chromist plastid monophyly. The “Best” ME-gtr is shown, as are trees 1, 2, and 3, in which the cryptophytes, haptophytes, and stramenopiles, respectively, are placed within the derived red algae (see arrow). Trees 4 and 5 test cryptophyte–stramenopiles and Chromista–Cyanidiales monophyly, respectively.

