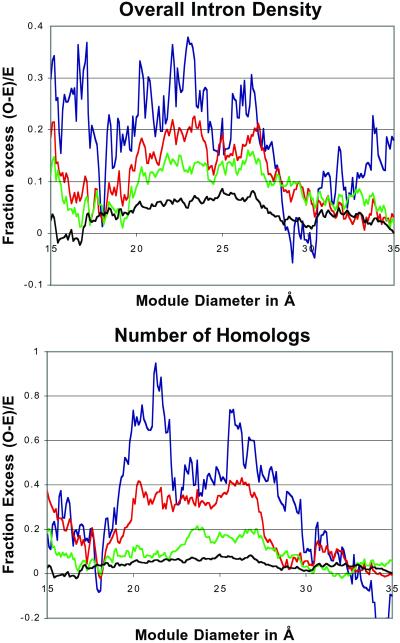
Fig 3.
Relationship of phase zero intron–module boundary correlation to overall intron density and number of homologs. (Upper) The correlation for all phase zero positions in ACRs (black) and for the subsets of ACRs with d or fewer intron positions per 100 codons for d = 2 (blue), d = 6 (red), and d = 8 (green). The plot for d = 4, which follows the trend, has been omitted for clarity. (Lower) The correlation for all phase zero positions in ACRs (black) and for the subsets of ACRs with h or fewer intron-containing homologs for which gene structures are known for h = 1 (blue), h = 5 (red), and h = 10 (green).

