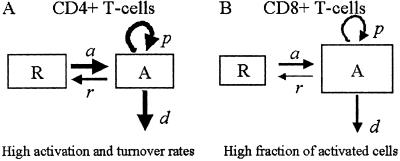
Fig 5.
Representation of the main findings regarding the differential dynamics of CD4+ (A) and CD8+ (B) T cells. Bold arrows mean that the parameter is increased in relation to normal individuals, and the larger size of the activated population box in CD8+ represents the increase in this population in relation to healthy individuals.

