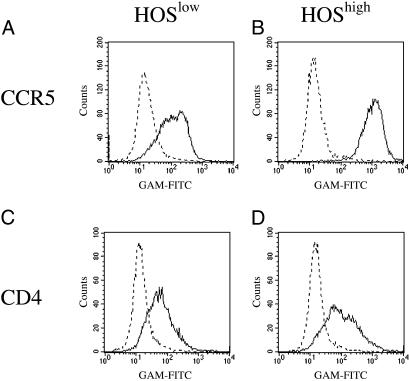
Fig 1.
CCR5 (A and B) and CD4 (C and D) expression on HOSlow (A and C) and HOShigh (B and D) cells. Cells were exposed to an anti-CCR5 or anti-CD4 antibody (full line) or to a negative control antibody (dotted line), labeled with an FITC-conjugated anti-mouse Ig probe, and analyzed by flow cytometry.

