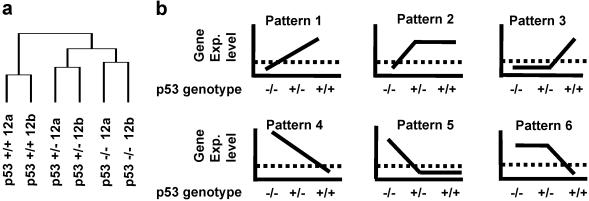
Fig 1.
Gene expression analysis of p53 +/+, p53 +/−, and p53 −/− cells. (a) Dendrogram showing the similarities in the expression patterns of the samples (also see Fig. 4). (b) Expression patterns within genotypes at the 12-h time point. Schematic representation of the patterns of gene expression defined by significance testing (see Materials and Methods). A detection threshold for gene expression estimates was defined (dotted line).

