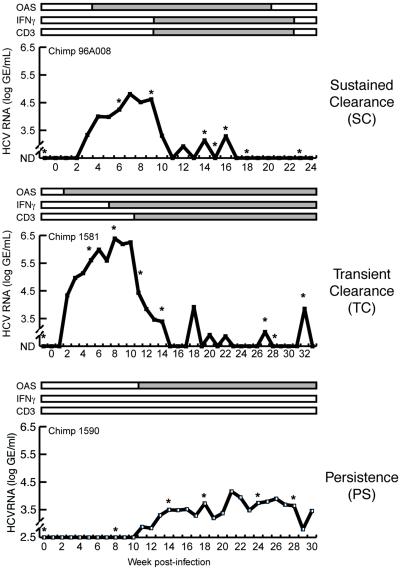
Fig 1.
The time course of infection for the three chimpanzees is shown. The x axis indicates the week postinfection at which a liver biopsy was taken. The y axis shows log HCV genome equivalents per milliliter of serum (GE/ml). Values below the limit of detection are shown as not detected (ND). Levels of oligoadenylate synthase, IFN-γ, and CD3 mRNA were also determined by RNase protection assays (8), and their presence in the liver is shown by the gray bars. In this study, gene expression profiling was performed on the biopsy samples at time points indicated by asterisks.

