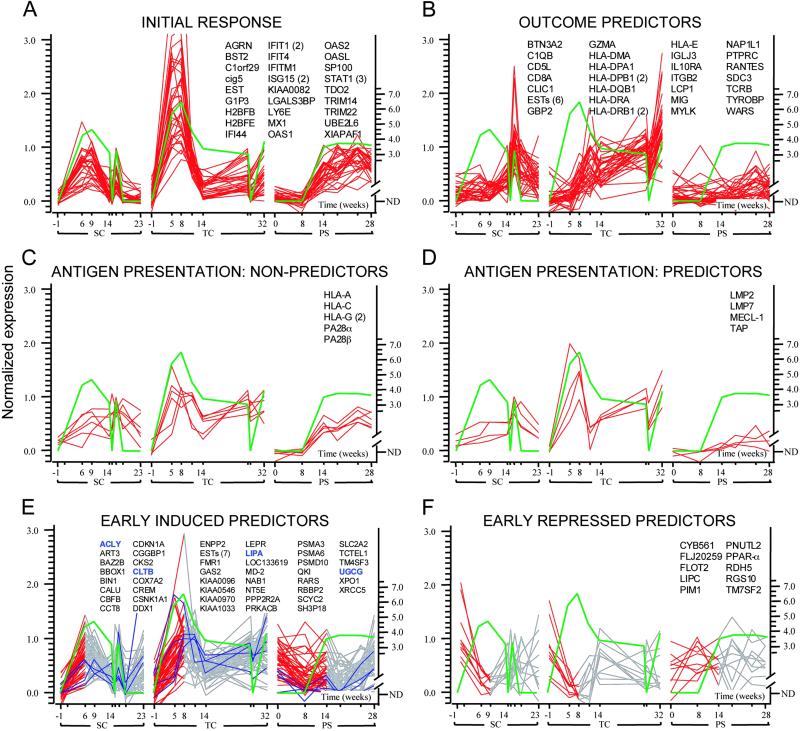
Fig 2.
Genes coordinately regulated during HCV infections in SC, TC, and PS. Green lines represent log (HCV RNA) patterns with values below the threshold for detection represented by zero. Data traces are shown for different clusters of genes: (A) genes correlating with HCV RNA in all chimpanzees; (B) genes that are negatively correlated with HCV RNA levels during clearance episodes and correlated with IFN-γ levels and T cell influx to the liver (Fig. 1); (C) MHC class I and proteasome nonpredictor genes; (D) antigen presentation-related genes that show outcome-specific expression; (E) early predictors correlated with increasing HCV RNA levels with representative hepatocellular early predictor genes associated with lipid metabolism highlighted in blue; and (F) early predictors negatively correlated with increasing HCV RNA levels. For the early predictor genes in E and F, the portion of the gene expression pattern depicted in red is the region that positively or negatively correlates with the initial rise of HCV RNA. If multiple probes interrogate the same gene, the probe count appears in parentheses. For optimal visualization, gene expression levels were normalized to the 10th and 90th percentiles for each gene. Values on the x axis represent days after inoculation with HCV. The primary data for all clusters can be found in Table 1, which is published as supporting information on the PNAS web site.

