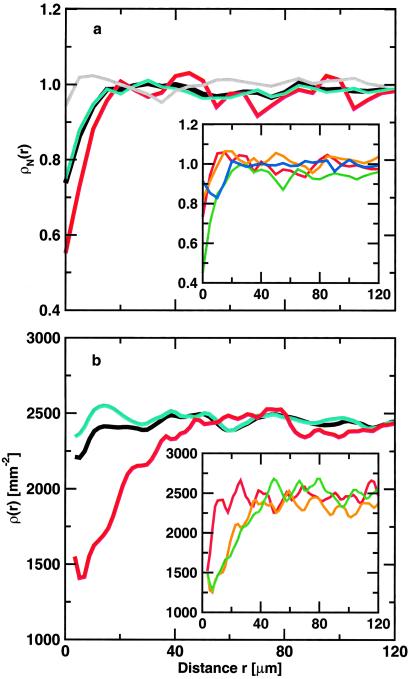
Fig 2.
(a) Normalized neuronal density ρN(r) averaged over five AD cases with average neuron densities of 1,563, 763, 1,087, 1,597, and 862 neurons per mm2 for (i) all Aβ deposits with n = 1,287 (black), (ii) non-ThioS Aβ deposits with n = 996 (cyan), (iii) ThioS-positive Aβ deposits with n = 223 (red), and (iv) randomly shuffled Aβ deposits with n = 1,287 (gray). (Inset) Normalized neuronal density ρN(r) for different size classes of Aβ deposits with respect to the radius R of the deposit, averaged over five different AD cases: (i) R < 7 μm (red), (ii) 7 < R < 10 μm (orange), (iii) 10 < R < 15 μm (green), and (iv) R > 15 μm (blue). (b) Neuronal density ρ(r) in transgenic mice with an average neuronal density of 2,468 per mm2 with respect to the center of mass of the Aβ deposits. We plot ρ(r) for all Aβ deposits with n = 982 (black), non-ThioS (cyan) with n = 819, and ThioS-positive (red) Aβ deposits with n = 166. (Inset) Neuronal densities ρ(r) around ThioS-positive Aβ deposits of different effective radia R: (i) R < 12.3 μm (red) with n = 31, (ii) 12.3 < R < 24.8 μm (orange) with n = 78, and (iii) R > 24.8 μm (green) with n = 58.

