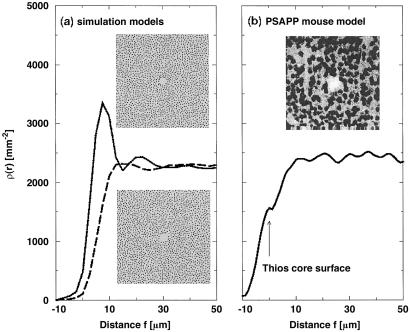
Fig 4.
(a) Neuronal density ρ(r) from the molecular dynamics simulations for the nontoxic and toxic model. In each case, ρ(r) is averaged over a set of sizes obtained from the ThioS size distribution with n = 254. Neuronal density ρ(r) for the nontoxic model shows a rather prominent peak of neuronal density that would correspond to a denser ring of neurons around the deposit. Neuronal density ρ(r) for the toxic model displays no such peak, indicating that neurons are not merely pushed away as the deposit grows but rather destroyed. The Insets correspond to typical computer realizations for each model, where the initial position for the nonoverlapping small circles (model neurons) is random and the total density and radius [Nneu = 1,850 in a 512 × 512 pixel2 box, R = 4 pixels (3.5 μm)] is taken to be equivalent to the average density and radius of neurons in the PSAPP transgenic mice. The central deposit (only the hole shown) in each Inset has a radius of 18 pixels (15.7 μm). (b) Neuronal density ρ(r) in dependence on the distance from the surface of a ThioS core in transgenic mice. For each deposit ρ(r) is shifted by the radius of the ThioS core. Individual functions ρ(r) are then averaged over all 281 ThioS cores. (Inset) A confocal image of Neu-N-stained PsAPP mouse brain showing a hole in the otherwise rather homogeneous distribution of neurons.

