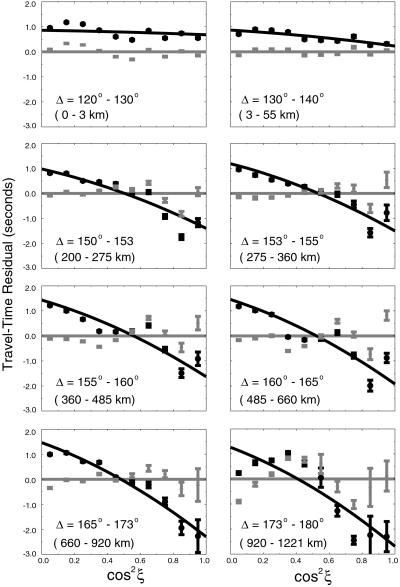
Fig 2.
Fit to DF data at various distance ranges. Observed DF travel-time data (black circles with error bars) and residual DF data after correcting for a constant anisotropy model (gray circles with error bars) for various distance ranges. The values shown below the epicentral distance range correspond to the bottoming depth of the data below the inner-core boundary. Prediction based on the bulk inner-core anisotropy model (22) is shown as a black curve, and the zero line is shown in gray. The standard deviation of the mean is shown as the uncertainty of each averaged datum point.

