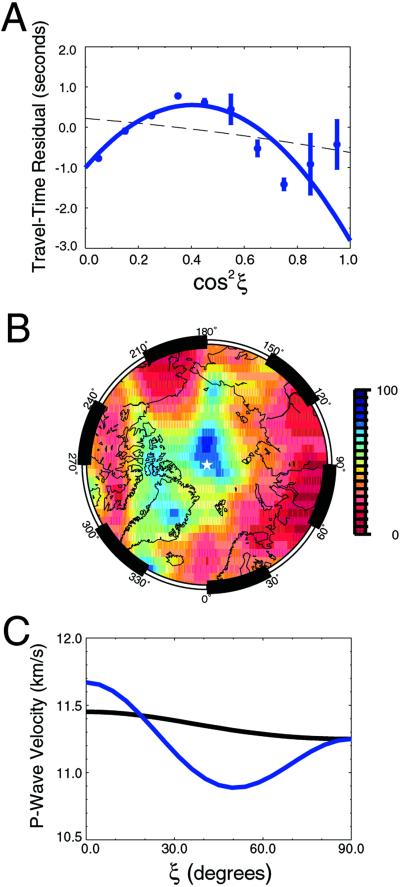
Fig 5.
Data from the IMIC. DF data in the distance range between 173° and 180° after the removal of signal due to inner-core anisotropy in the top 920 km. (A) Averaged data (blue dots with error bars) with a prediction (blue solid curve) that assumes that the symmetry axis is aligned with the rotation axis. The prediction based on an anisotropy model of the bulk inner core (22) is shown by the dashed curve. (B) Grid-search result for best-fitting symmetry axis location showing the variance reduction as a function of the symmetry axis location. The center of this map is the North Pole (white star). Note that the color scale is not linear but is characterized by a small increment at high values to emphasize change as a function of axis location. (C) Velocity variation as a function of ξ for a bulk inner-core model (black curve) and the IMIC model (blue curve).

