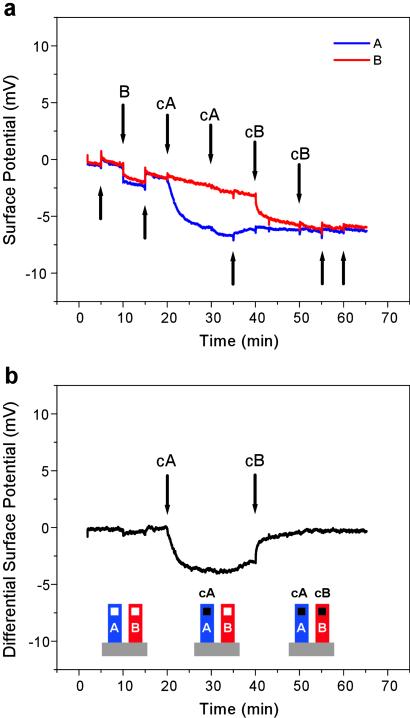
Fig 3.
Field-effect detection of DNA hybridization. (a) Surface potential response from sensor 1 (blue) functionalized with probe oligonucleotide A and sensor 2 (red) functionalized with probe oligonucleotide B during a hybridization experiment. Downward arrows indicate injections of oligonucleotides, and upward arrows indicate injections of buffer into the fluid cell. (b) Differential signal obtained by subtracting the two sensor signals shown in a (sensor 1-sensor 2). The order of injections was: buffer, B (80 nM), buffer, cA (80 nM), cA (200 nM), buffer, cB (80 nM), cB (200 nM), and buffer. The second injection of either cA or cB did not result in a change in hybridization signal, indicating that saturation was reached.

