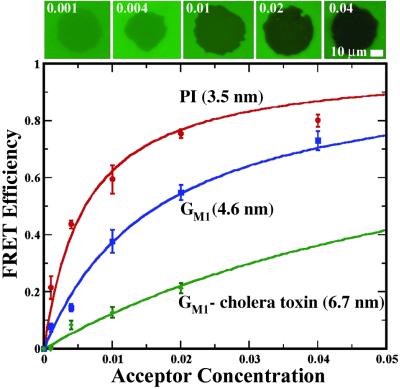
Fig 4.
FRET efficiency data for PI, GM1, and GM1: cholera toxin membrane junctions. The sequence of images depicts FRET footprints from PI junctions for each of the acceptor (Texas red DHPE) mole fractions (σ) as labeled. Solid curves represent calculations based on Eq. 3 with intermembrane-separation distances (z) as labeled.

