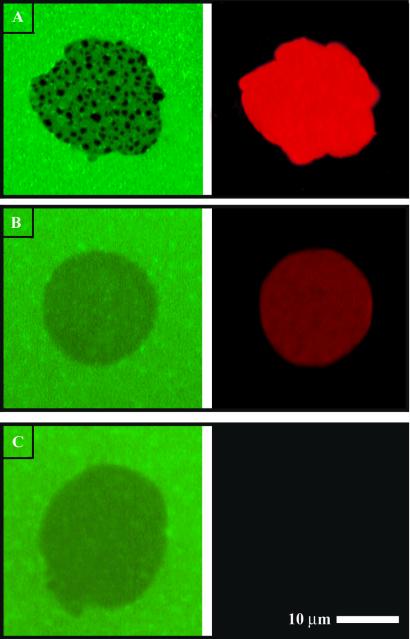
Fig 7.
PEG-lipid membrane junctions (0.3 mol % PEG-lipid in the upper membrane) with 2 (A), 0.1 (B), and 0.0 mol % (C) Texas red DHPE acceptor in the upper membrane. At 2 mol %, FRET is clear and patterns caused by PEG-induced membrane topography can be seen. At 0.1 mol % or less acceptor, FRET is not visible. The remaining trace of a footprint seen in B and C results from non-FRET effects of the PEG lipid as discussed in Results and Discussion.

