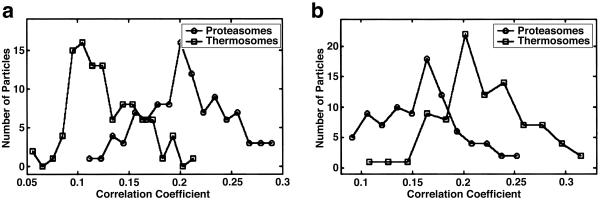
Fig 4.
(a) Histogram of the correlation coefficients of the particles found in the proteasome-containing phantom cell scanned with the “correct” proteasome and the “false” thermosome template. Of the 104 detected particles, 100 were identified correctly. The most probable correlation coefficient is 0.21 for the proteasome template and 0.12 for the thermosome template. (b) Histogram of the correlation coefficients of the particles found in the thermosome-containing phantom cell. Of the 88 detected particles, 77 were identified correctly. The most probable correlation value is 0.21 for the thermosome template and 0.16 for the proteasome template.

