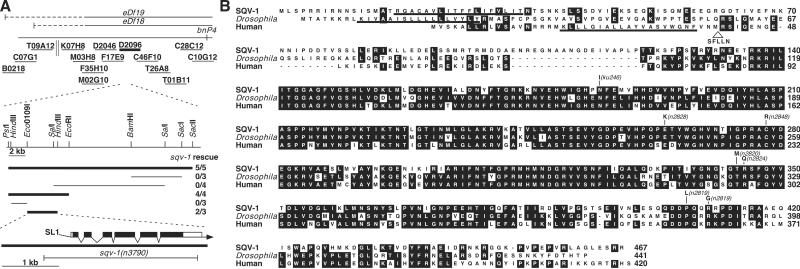
Fig 1.
sqv-1 cloning and SQV-1 protein sequence comparisons. (A) Cloning of sqv-1. Genetic and physical maps of the sqv-1 region (Upper). The solid horizontal lines at the top indicate the extents of the chromosomal deletions eDf18 and eDf19; the dashed horizontal lines indicate uncertainty in their left end points. The short solid horizontal lines represent cosmid clones assayed in germline transformation experiments. The parallel vertical lines represent a gap in cosmid coverage of the C. elegans genome. The D2096 cosmid, which rescued the sqv-1 mutant phenotype, is shown in bold. (Lower) Subclones derived from the cosmid D2096 were tested for sqv-1 rescuing activity. Subclones that rescued the sqv-1 mutant phenotype are shown in bold. The rescue experiment results are shown as the number of transformed lines that rescued/total number of lines. The structure and location of the sqv-1 gene as deduced from the genomic and cDNA sequences relative to the minimal rescuing subclone are shown. Solid boxes indicate exons, and open boxes indicate untranslated sequences. The 5′-trans-spliced leader SL1 is indicated, and the arrow represents the 3′ poly(A) tail. The extent of the deletion in sqv-1(n3790) is indicated by a horizontal line. (B) Sequence alignment of SQV-1 and human and Drosophila homologs. The numbers on the right indicate amino acid positions. Residues identical in at least two proteins are shaded in black. Missense mutations in sqv-1 mutants are indicated. The addition of five amino acids (SFLLN) after amino acid 40 in an alternatively spliced form of the human protein is indicated. The putative transmembrane domains are underlined.

