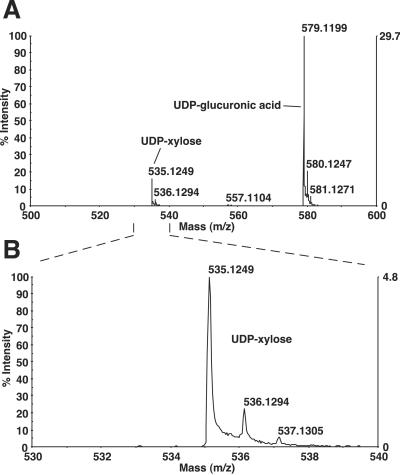
Fig 2.
Conversion of UDP-glucuronic acid to UDP-xylose by SQV-1. UDP-glucuronic acid and NAD+ were incubated with MBP-SQV-1, purified, and injected into a capillary ion pair RP-HPLC coupled to an electrospray time-of-flight mass spectrometer. (A) Negative polarity mass spectra of SQV-1 reaction sample from elution time of 8.02–35.02 min. The y axis indicates the intensities of the spectra relative to the most intense peak, and the x axis indicates the mass (m/z). Peaks of mass (m/z) of 500–600 are shown. (B) Magnification of mass spectra for mass (m/z) of 530–540. The highest peak at ≈535 represents the most abundant mass of UDP-xylose. The smaller peaks at ≈536 and ≈537 likely represent isotopic distributions of UDP-xylose.

