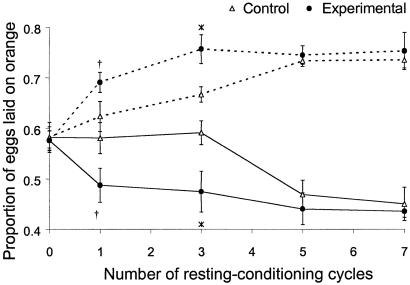
Fig 5.
Comparison of the rate of learning (generation 47). The response of experimental and control populations to conditioning as a function of the total conditioning time (the number of resting–conditioning cycles). Solid lines, flies conditioned to avoid orange; dashed lines, flies conditioned to avoid pineapple. Bars represent ± one standard error; the asterisk indicates a significant difference (t test, P < 0.05) between the experimental and control lines for a given conditioning treatment; the dagger indicates 0.05 < P < 0.08.

